DataViz WebApp extend a new line symbol set |
In DataViz WebApp, you can extend of point and line symbol sets to meet the needs of personalized style in vector layers. The custom point styles can be applied to the point layer styles of Base, Unique and Rank Symbol, and the custom line styles can be applied to the line layer style of Base.
This section will take the extension of a line symbol Tab page and two line symbols as an example to introduce the extension development in detail.
Step 1
Open symbol-point.json from the /META-INF/resources/apps/dataviz/libs/plugins directory of the unzipped webjar-dataviz-*.jar found in the [iPortal product package] /webapps/iportal/WEB-INF/lib directory, you can add new Tab page “water” of point symbols, which is shown as following content in bold code.
{
"traffic": { ...
},
//add new Tab page “water”
"water": {
"label": "Water",
"items": [
]
}
}
Step 2
Add new line symbols "normal river" and "seasonal River" to "items" under the "water" Tab page, as shown in the following bold code:
{
"traffic": { ...
},
//add new Tab page “water”
"water": {
//add new line symbol “ Ordinary river”
"label": "Water",
"items": [
{
"id": "riverOrdinary",
"label": "Ordinary River",
"thumbnail": "static/imgs/layer_editor/lineType/dark/river.svg",
"styleConfigs": [
{
"strokeColor": {
"label": "Line Color",
"controlType": "color"
},
"strokeWidth": {
"label": "Line Width",
"controlType": "number"
},
"strokeOpacity": {
"label": "Line Opacity",
"controlType": "percent"
},
"lineCap": {
"label": "Line Cap",
"controlType": "select"
}
}
],
"styles": [
{
"strokeColor": "#5bc3f1",
"strokeWidth": 1.82,
"strokeOpacity": 1,
"lineCap": "butt"
}
]
},
//add new line symbol “ Seasonal river”
{
"id": "riverSeason",
"label": "Seasonal River",
"thumbnail": "static/imgs/layer_editor/lineType/dark/riverseason.svg",
"styleConfigs": [
{
"strokeColor": {
"label": "Dash line color 1",
"controlType": "color"
},
"strokeWidth": {
"label": "Dash line width 1",
"controlType": "number"
},
"strokeOpacity": {
"label": "Dash line opacity 1",
"controlType": "percent"
},
"lineCap": {
"label": "Dash line cap 1",
"controlType": "select"
}
},
{
"strokeColor": {
"label": "Dash line color 2",
"controlType": "color"
},
"strokeWidth": {
"label": "Dash line width 2",
"controlType": "number"
},
"strokeOpacity": {
"label": "Dash line opacity 2",
"controlType": "percent"
},
"lineCap": {
"label": "Dash line cap 2",
"controlType": "select"
}
}
],
"styles": [
{
"strokeColor": "#5bc3f1",
"strokeWidth": 4.16,
"strokeOpacity": 0,
"lineCap": "round"
},
{
"strokeColor": "#5bc3f1",
"strokeWidth": 2.4,
"lineDash": [13.23, 13.23],
"strokeOpacity": 1,
"lineJoin": "round",
"lineCap": "butt"
}
]
}
]
}
}
Step 3
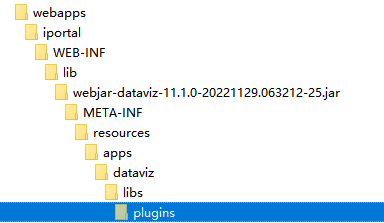
Recompress symbol-line.json into the iPortal product package/webapps/iportal/WEB-INF/lib/webjar-dataviz-*.jar (location: /META-INF/resources/apps/dataviz/libs/plugin/), the target folder structure is as follows.
Step 4
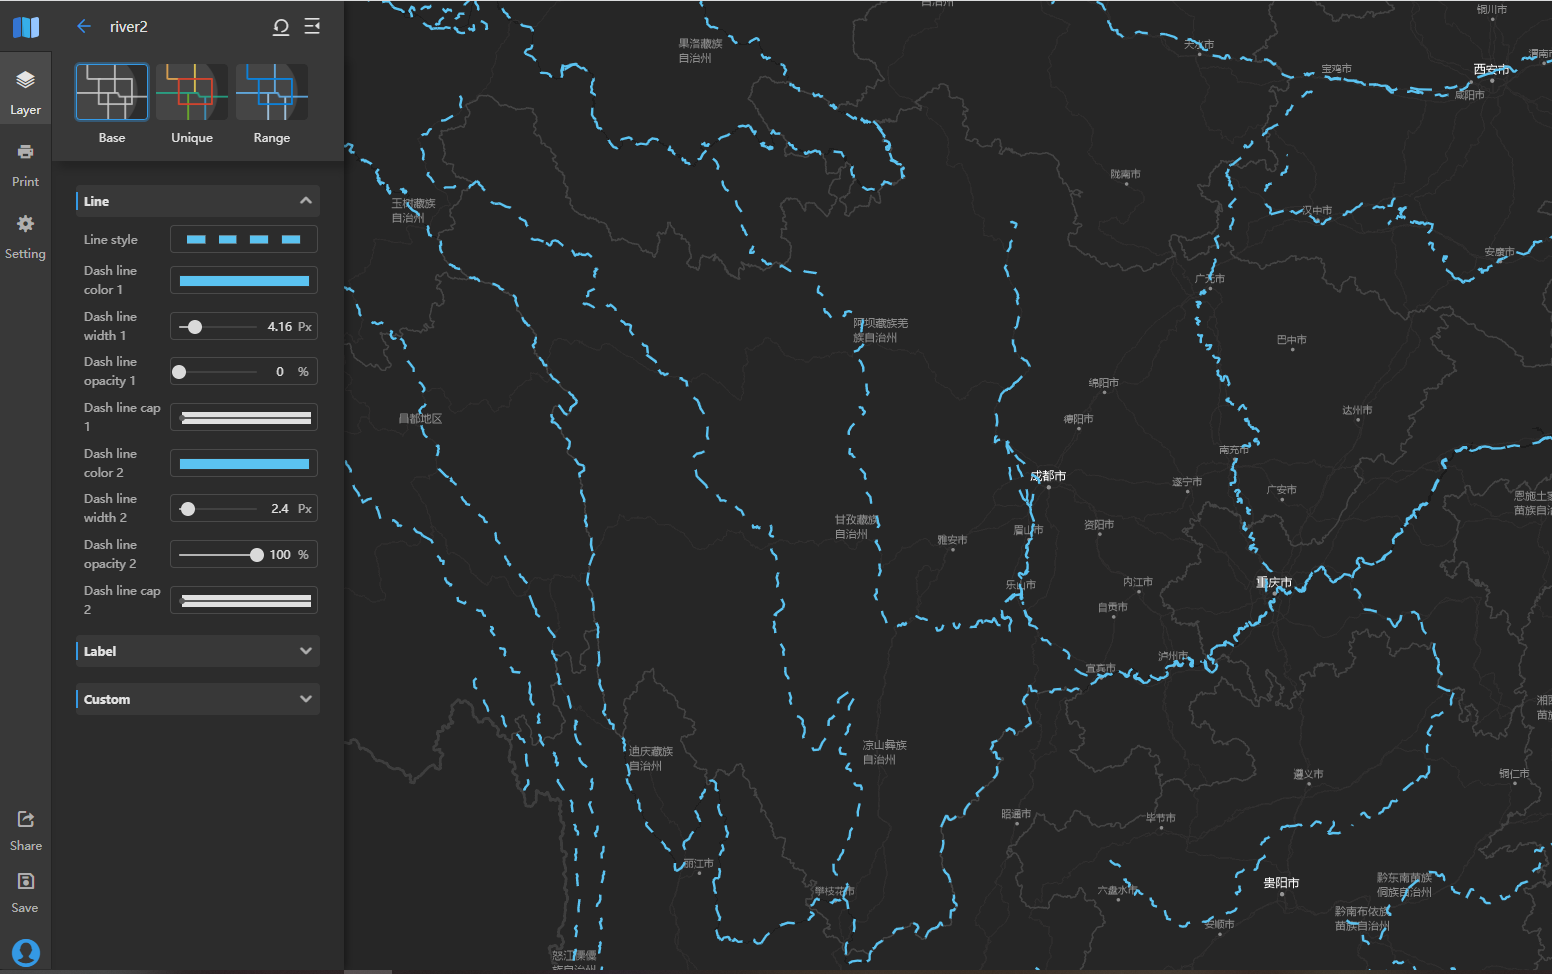
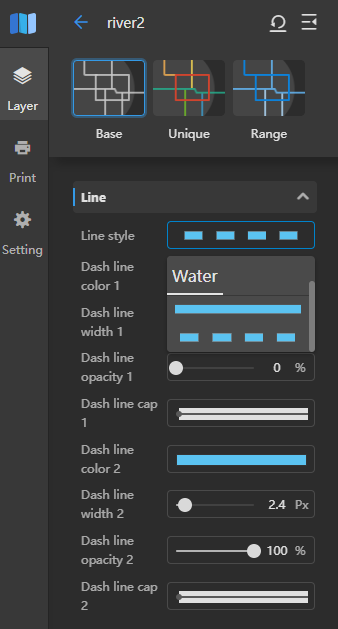
Access iPortal in the browser, after logging in, click “App Center” in the navigation bar, and choose to enter DataViz WebApp on the left sidebar. After adding and opening a line layer, you can use new line symbols and see the extended effect, which can be accessed in line style from Base style in layer panel.
The extension effect of line symbol set "Water":
The using effect of line symbol "Seasonal River":